
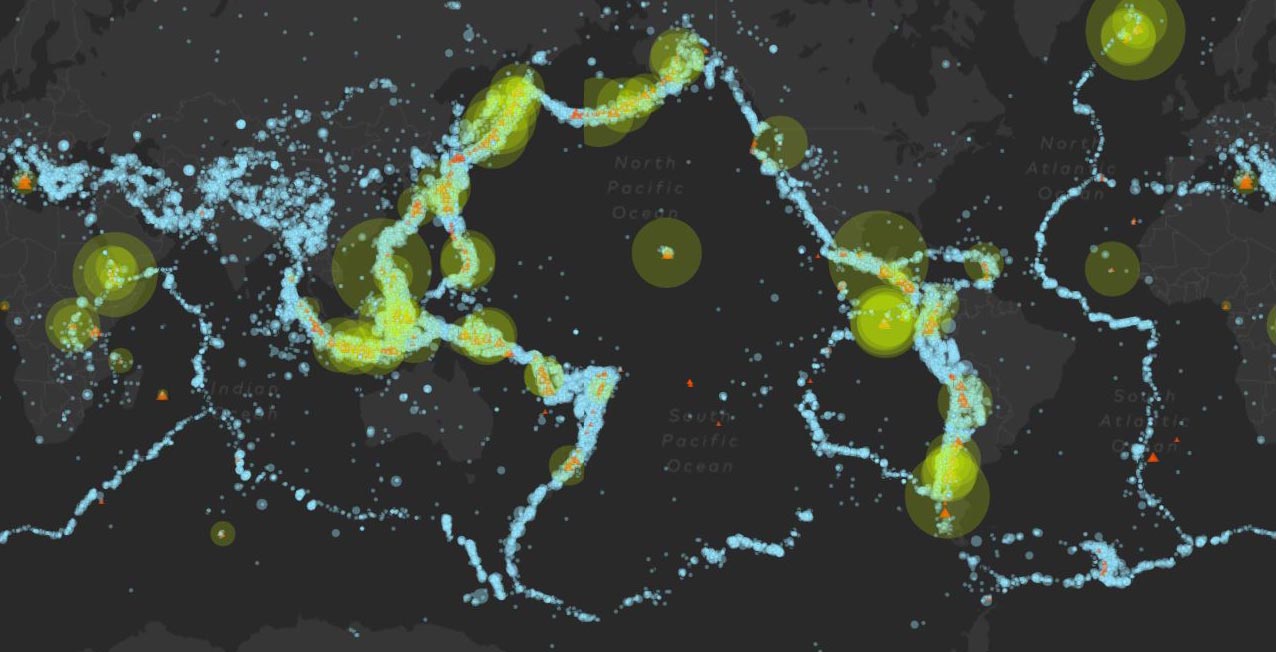
Excellent animation illustrates the rhythm, which lives on the Earth. Researchers of the National Museum of natural history, Smithsonian institution (USA) has created a map that shows eruptions, earthquakes and toxic emissions on the planet. Scientists say that the map is similar to the pulse of the Earth.
The map shows every recorded volcanic eruption, earthquake and a major release of sulfur dioxide since 1960. Emissions of sulfur dioxide from volcanic activity began to record in 1978 of the earth’s satellites.
“Imagine that you are an alien in a spaceship high above the Earth, says Elizabeth Cottrell, a geologist researcher from the National Museum of natural history and Director of the Global program of study of volcanic processes. — If you look down, you will see how the pulse of the planet. Breath, inhale and exhale”.
Researchers say the map will help to find a connection between the earthquakes around the world. A recent study of the Deep carbon Observatory, a global research program that studies the carbon cycle in nature, suggests that the measurement of the ratio of gas to carbon from volcanoes to help predict when they will explode.
To evaluate volcanic activity and gas emissions on a global scale, the researchers program at Cambridge University (UK) try another approach — measuring volcanic gases from space using satellites. Once the data has been collected, it will also be marked on the map.


